How AI Helps The Carlyle Group Make Better Investment Decisions
December 21, 2021
•
5 mins read
The world of private equity has been fertile ground for the adoption of alternative data, including AI-driven insights from firms like SESAMm, an expert in Natural Language Processing (NLP).
Could SESAMm’s technology provide Carlyle with the tools to identify a better class of investment opportunity?
When SESAMm’s CEO Sylvain Forté met the man in charge of data at The Carlyle Group, at an industry conference, the opportunity arose to put SESAMm’s data to the test.
“I remember the first day I met Sylvain and he said, I can tell you if your company is trending positively or negatively on the internet,” recounts Matt Anderson, Chief Data Officer of Carlyle, at a recent PE Insights webinar, in which EQT and Apollo were also speaking. Sensing potential in the data, he decided to give it a go.
SESAMm’s NLP platform generates quantitative and qualitative analytics on a wide array of entities – from public and private companies, to brands, products and individuals, by running cutting edge algorithms across billions of web-based articles.
Their data lake is not limited to news stories from the New York Times or Wall Street Journal, but spans a whole variety of global sources – social media, blog posts, professional forums, customer reviews and more, in over 100 languages.
Using this ability to interpret unstructured text from a huge slice of the internet, SESAMm’s team created insights designed to help Matt’s deal teams evaluate target companies.
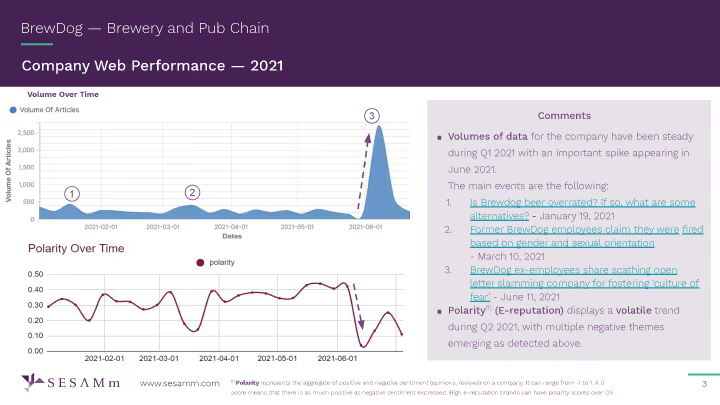
The challenge was getting investment professionals to buy into the value of alternative data for private companies, so SESAMm condensed everything into easily-digestible reports. They included time-series and charts measuring companies on a variety of key metrics versus their peers, including ESG risk, e-reputation, competitive positioning, sentiment, positive and negative themes and other critical KPIs.
Fig 1. An Example of one of SESAMm’s deal slides, in this case for brewery Brewdog (Not a Carlyle portfolio company).
By regularly presenting SESAMm’s analytics reports to investment committees, Sylvain and Matt hoped to gradually convince deal teams that alternative data could have a positive impact on the investment process.
“It was about sharing the data in the form of slides directly with deal teams in a way that was automated on our side but easily consumable as part of the pre-deal decision process”, said Forté.
“We saw the need to convince people and show, time after time, that it really works, that this data is really valuable and can give an edge”, added Forté.
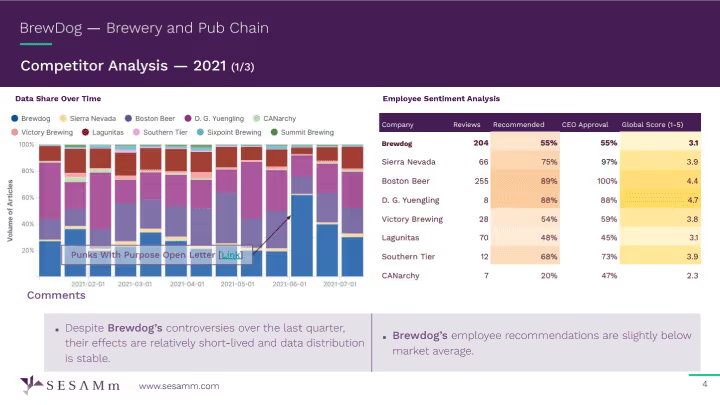
Fig 2. A deal slide showing competitor analysis.
“In some instances it helped us to not make investments or avoid allocating resources to things that were marginal or moving in the wrong direction, and that was really valuable”, said Anderson.
To further prove the value of the data, Matt asked Sylvain to create analytics reports on a selection of Carlyle’s historical target companies. The idea was to see if SESAMm’s scores and analytics were predictive of the deal outcome, whether positive or negative.
“If we put a number on how positive SESAMm feels about some of these deals between one and ten, with one being, ‘avoid at all costs’ , and ten, ‘go for it’, what would it have told us?”, said Anderson.
After running the back test, the results showed a clear correlation between SESAMm’s analysis, and the deals that performed well and those that fell through.
“Looking at the results, I think that people would have really paused an investment committee around some of the conclusions”, commented Anderson.
“Having a view of the themes being surfaced, the plateaus in certain trends, and the sentiment charts heading in a negative direction was eye-opening for our leaders and deal teams – because they had to actually live through those deals. So seeing that kind of data, and what it can help you avoid was really insightful.” Says Anderson.
Ultimately, the integration of SESAMm’s analytics reports into Carlyle’s investment process was so successful that they were rolled out across all global investment teams. The two companies have developed a strong partnership based on the proven value of alternative data in the private equity investment process.
To find out how SESAMm can support your investment decision-making, to request a demo or for any other questions regarding our data do not hesitate to contact info@sesamm.com.
Infrastructure sits at the center of the energy transition, and it's also one of the sectors most exposed to ESG controversy, from community displacement and water pollution to safety failures and corruption. As LPs, lenders, and regulators sharpen their scrutiny, knowing where that risk concentrates and how it evolves has become essential to due diligence and portfolio monitoring alike.
This whitepaper draws on SESAMm's analysis of over 250,000 infrastructure projects worldwide between 2021 and 2026, built on our natural language processing engine's coverage of millions of news, NGO, and regulatory sources.
It covers which project types carry the highest ESG risk, which pillar (Environmental, Social, or Governance) dominates the narrative, what drives spikes in governance controversy, and how two contrasting case studies, the Turów and Cerrejón coal mines, show just how differently a controversy can play out over time.
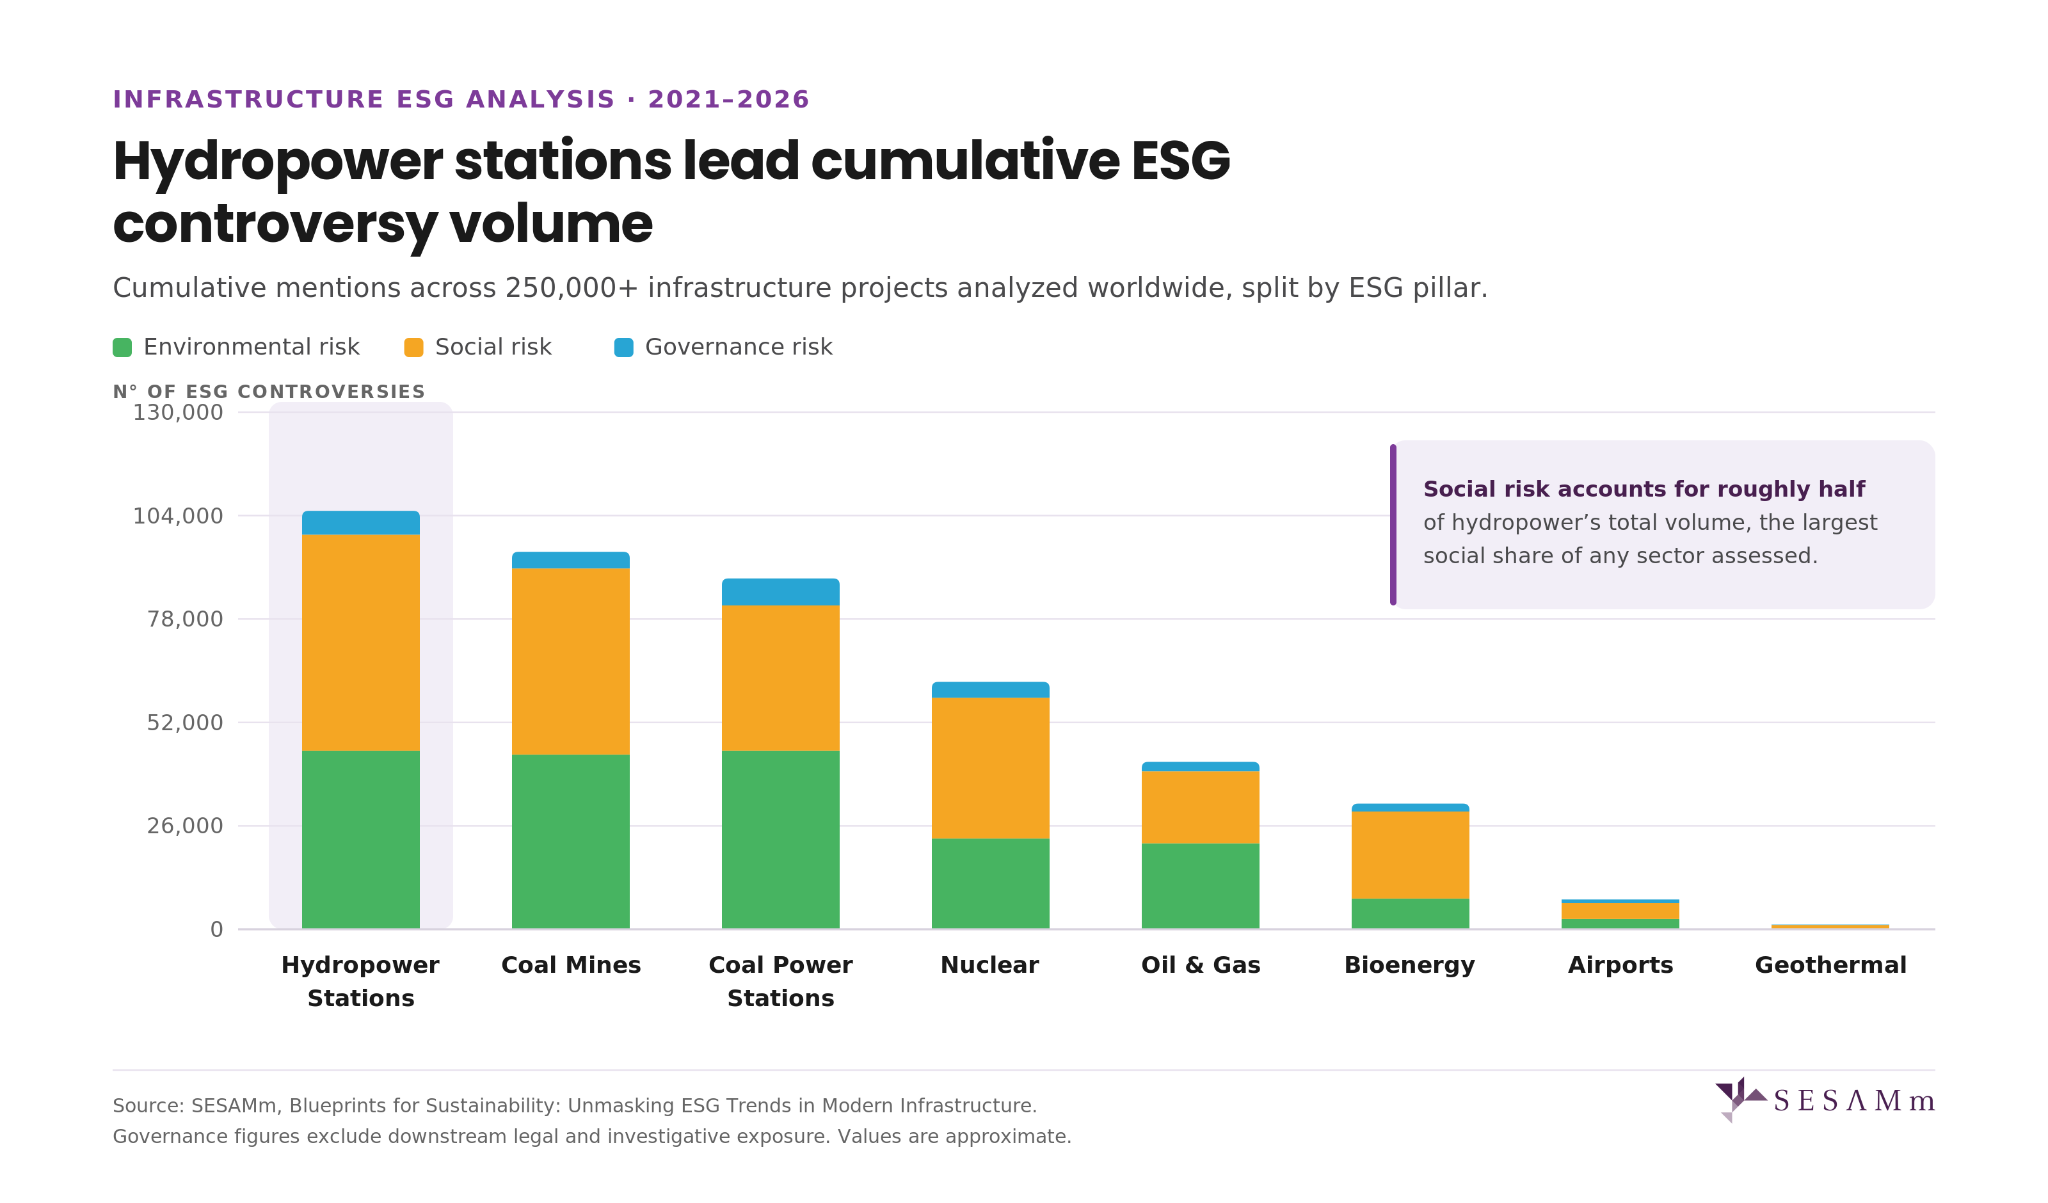
An analysis of over 250,000 infrastructure projects reveals that the sector most often filed under "clean energy" carries the heaviest environmental and social controversy footprint of any asset type assessed.
In the taxonomy of energy infrastructure, hydropower occupies a comfortable position. It is renewable, dispatchable, and long-lived, and it enters transition frameworks, green bond eligibility criteria, and net-zero roadmaps with minimal friction. Where coal is a legacy liability to be managed down and nuclear invites a specialized debate, hydropower is largely treated as settled. What these projects have actually done does not support that treatment.
Belo Monte, an 11,233 MW complex on the Xingu River in Pará, Brazil, is the sharpest test of the point, because it was built to answer this exact objection. Approved after decades of opposition to a far larger design, it was engineered as a run-of-river plant to minimize flooding, and its reservoirs cover 478 km², of which 274 km² was already river channel at high water, a 61% reduction compared with the 1980s proposal, according to the operator's own regulatory filing. The mitigation was designed from the start, and everything that follows happened regardless.
Biodiversity: the cost of a physical footprint
Environmental controversy across infrastructure concentrates on industrial accidents, water pollution, and biodiversity, and hydropower leads the third, outright, because dams require the permanent conversion of river systems and the land around them. Mexico's Federal Electricity Commission won environmental approval in September 2014 for the Las Cruces dam on the San Pedro Mezquital, upstream of Marismas Nacionales, a Ramsar-protected wetland, even though the project's own impact statement conceded that the damage to Indigenous ceremonial sites could not be mitigated. Along the Mekong River, river health and fish populations fell as dam construction spread through the basin. In Brazil, the Doce River carried a mass release of toxic material after an upstream failure. Elsewhere, the record includes violations of the Endangered Species Act and documented disruption to rainfall patterns.
At Belo Monte, the consequences have been measured rather than projected. The plant diverts water into a canal that bypasses a 130-kilometer stretch of the Xingu known as the Volta Grande, which has received less than 30% of its natural annual discharge since 2019, and some 86% of the stretch's seasonally flooded vegetation, 30,748 of 35,600 hectares, can no longer be inundated at all. The gap lies in the regulator's own file: IBAMA's technical staff called for 10,900 cubic meters per second in February, the historic peak month, compared with the 1,600 that the operating regime actually releases. Seven years of underwater video survey data published in Scientific Reports recorded total fish species richness falling from 62 to a post-operation average of 51, with the steepest losses near the dam and in the rocky rapids, which hold roughly 2.6 times as many species as sandy reaches. The zebra pleco, whose entire known range lies inside the dewatered stretch, now sits on Brazil's national list of threatened species as critically endangered.
None of this is an accident or a failure of operation. It is a structural consequence of the asset. A well-run dam still floods a valley, and a dam engineered specifically not to flood one still dewater the river below it.
When engineering fails: hydropower's physical risk profile
Coal mining leads infrastructure on industrial accidents, where the record is dominated by human tragedy and safety negligence: explosions, collapses, fires, and repeated, incremental failures. Hydropower ranks second, but its accidents take a different form, because in this sector, industrial failure means catastrophic engineering failure at scale. The record includes pipe ruptures causing severe land erosion, oil leaks, and dam collapses that killed and displaced people across whole regions, while PG&E's settlement over damages to the Middle Fork American River Hydroelectric Project and the litigation still running in Brazil after dam collapses give a sense of the exposure a single event can generate. For anyone underwriting these assets, the distinction is financial as much as physical: a coal mine's safety record is a rising cost curve, while a dam's structural integrity is a low-probability, near-unbounded loss.
At Belo Monte, that exposure has so far been financial. The project was budgeted at R$28.9 billion when Brazil's development bank approved a then-record R$22.5 billion loan in November 2012, and by late 2017, actual investment had reached R$38.6 billion, roughly 34% over. The operator owed R$28.3 billion to lenders and debenture holders at the end of 2024. Aliança Norte Energia Participações, the Vale and Cemig vehicle holding a stake in the project, discloses a possible loss of R$3.05 billion from a single construction-delay claim and describes the operator's liquidity as its principal point of attention and a source of investor alert. Neoenergia wrote off its own 10% holding by R$482 million in the fourth quarter of 2021.
The physical risk has been closer than the absence of a collapse suggests. In October 2019, the operator wrote to the national water regulator declaring an emergency, because reservoir levels had fallen far enough to expose an unprotected section of the Pimental dam's earthfill base to wind-driven wave erosion and, in the company's own words, structural damage. It cut outflow below the level agreed with the environmental regulator to protect the structure, and the letter surfaced only through investigative reporting.
Beyond the environment: displacement, water, and chronic corruption
Right to property
Hydropower ranks first among infrastructure sectors for property disputes, a direct function of the footprint a dam and reservoir require. The record shows land seizures, forced displacement, compensation that arrives short or not at all, communities never consulted before ground was broken, and blasting that cracked the foundations of nearby homes. Those affected are frequently the least equipped to hold an operator to account.
Fifteen years after Belo Monte broke ground there is still no audited count of who lost their homes. Estimates run from 20,000 to 40,000 depending on the definition used, against the operator's account of rehousing some 6,000 urban families. Landowners say expropriations are priced at unadjusted 2013 values while the project's own construction boom inflated the market, and as of 2025 none of the land required for the riverine resettlement program had been bought. A petition filed with the Inter-American Commission in 2011 still has no ruling.
Community health and safety
Hydropower sits alongside coal and nuclear as a leading source of community health disputes, but it arrives by a different route. Coal delivers PM2.5, nuclear delivers radioactive anxiety, and hydropower delivers water mismanagement: overconsumption that strips farmers of a livelihood, contaminated water reaching local crops. The grievance is agricultural rather than industrial, which widens the affected population considerably.
On the Volta Grande, catch per fisher fell from 11.1 kilograms a day between 2001 and 2008 to 4.53 kilograms between 2020 and 2023. A randomized household survey found 38.5% of residents in Belo Monte's resettlement neighborhoods living with moderate or severe food insecurity, against 28.3% across the surrounding city. In June 2026, federal prosecutors sought as interim relief for 635 families along the reduced-flow stretch the emergency delivery of three and a half to five liters of drinking water per person per day.
Corruption and bribery
Corruption and bribery accounts for close to 30% of governance controversy across infrastructure. What separates hydropower is the pattern. In airports, nuclear, and coal, corruption surfaces as discrete scandals: a probe opens, executives are charged, attention fades. In hydropower it keeps returning, tied repeatedly to falsified records and payments to local officials to secure land and water rights. Isolated scandals point to isolated actors. A pattern that recurs points to how these projects get permitted.
Brazilian prosecutors alleged that Belo Monte's construction contracts carried bribes worth 1% of their value, and three contractors admitted cartel conduct and kickbacks under leniency agreements that carried immunity. Everything after that was procedural closure rather than a finding of liability: the principal defendants were acquitted and the acquittal upheld on appeal in 2024, the competition authority archived its bid-rigging case in 2025, and no individual has been convicted in connection with the project. An investor screening for enforcement outcomes would have found a closed file. The costs landed elsewhere, in permitting delay, financing conditions, and a minority stake that has been for sale since 2022 without a buyer.
Hydropower's risk concentration: what this means
Hydropower's classification as clean energy is accurate on the metric it was designed to measure, because generation is low-carbon. But carbon intensity is one dimension of sustainability, and it is not the dimension that produces operational friction, legal exposure, or the loss of a social license.
What drew sustained opposition to these projects was water rights, displaced communities, cracked foundations, converted wetlands, and permits secured through local payments. None of it appears in a carbon accounting framework.
For investors, insurers, and lenders seeking transition-aligned infrastructure exposure, that is a material blind spot: an asset class that screens well on the primary criterion while carrying the heaviest social burden in the dataset, and carrying it on behalf of people who have no employment relationship with it. Belo Monte was engineered to avoid precisely that outcome and produced it regardless, which suggests the exposure is not a function of how a dam is built but of what a dam is.
The label is not wrong. It is simply measuring something other than risk.
Wildfires used to be a summer story. For most of the last decade, they arrived with the Northern Hemisphere dry season, dominated a few weeks of headlines, and receded once the rains came. That is no longer a safe assumption. Los Angeles burned in January 2025, a month that has historically been the quietest of the year for wildfire news anywhere in the world. Canada lost more forest in 2023 than in any year in its recorded history. Greece, Spain, and Portugal now post record-breaking fires in years that are not supposed to be their worst.
Given how much the pattern itself seems to be changing, we wanted to look past the headlines and into the data: how has coverage of wildfires actually moved over the past seven years, what does the aftermath of these fires look like once the smoke clears, and which countries, and companies, keep reappearing in the story. The analysis below sets out what the data shows, and, where it helps to understand it, what was actually happening on the ground at the time.
Executive summary
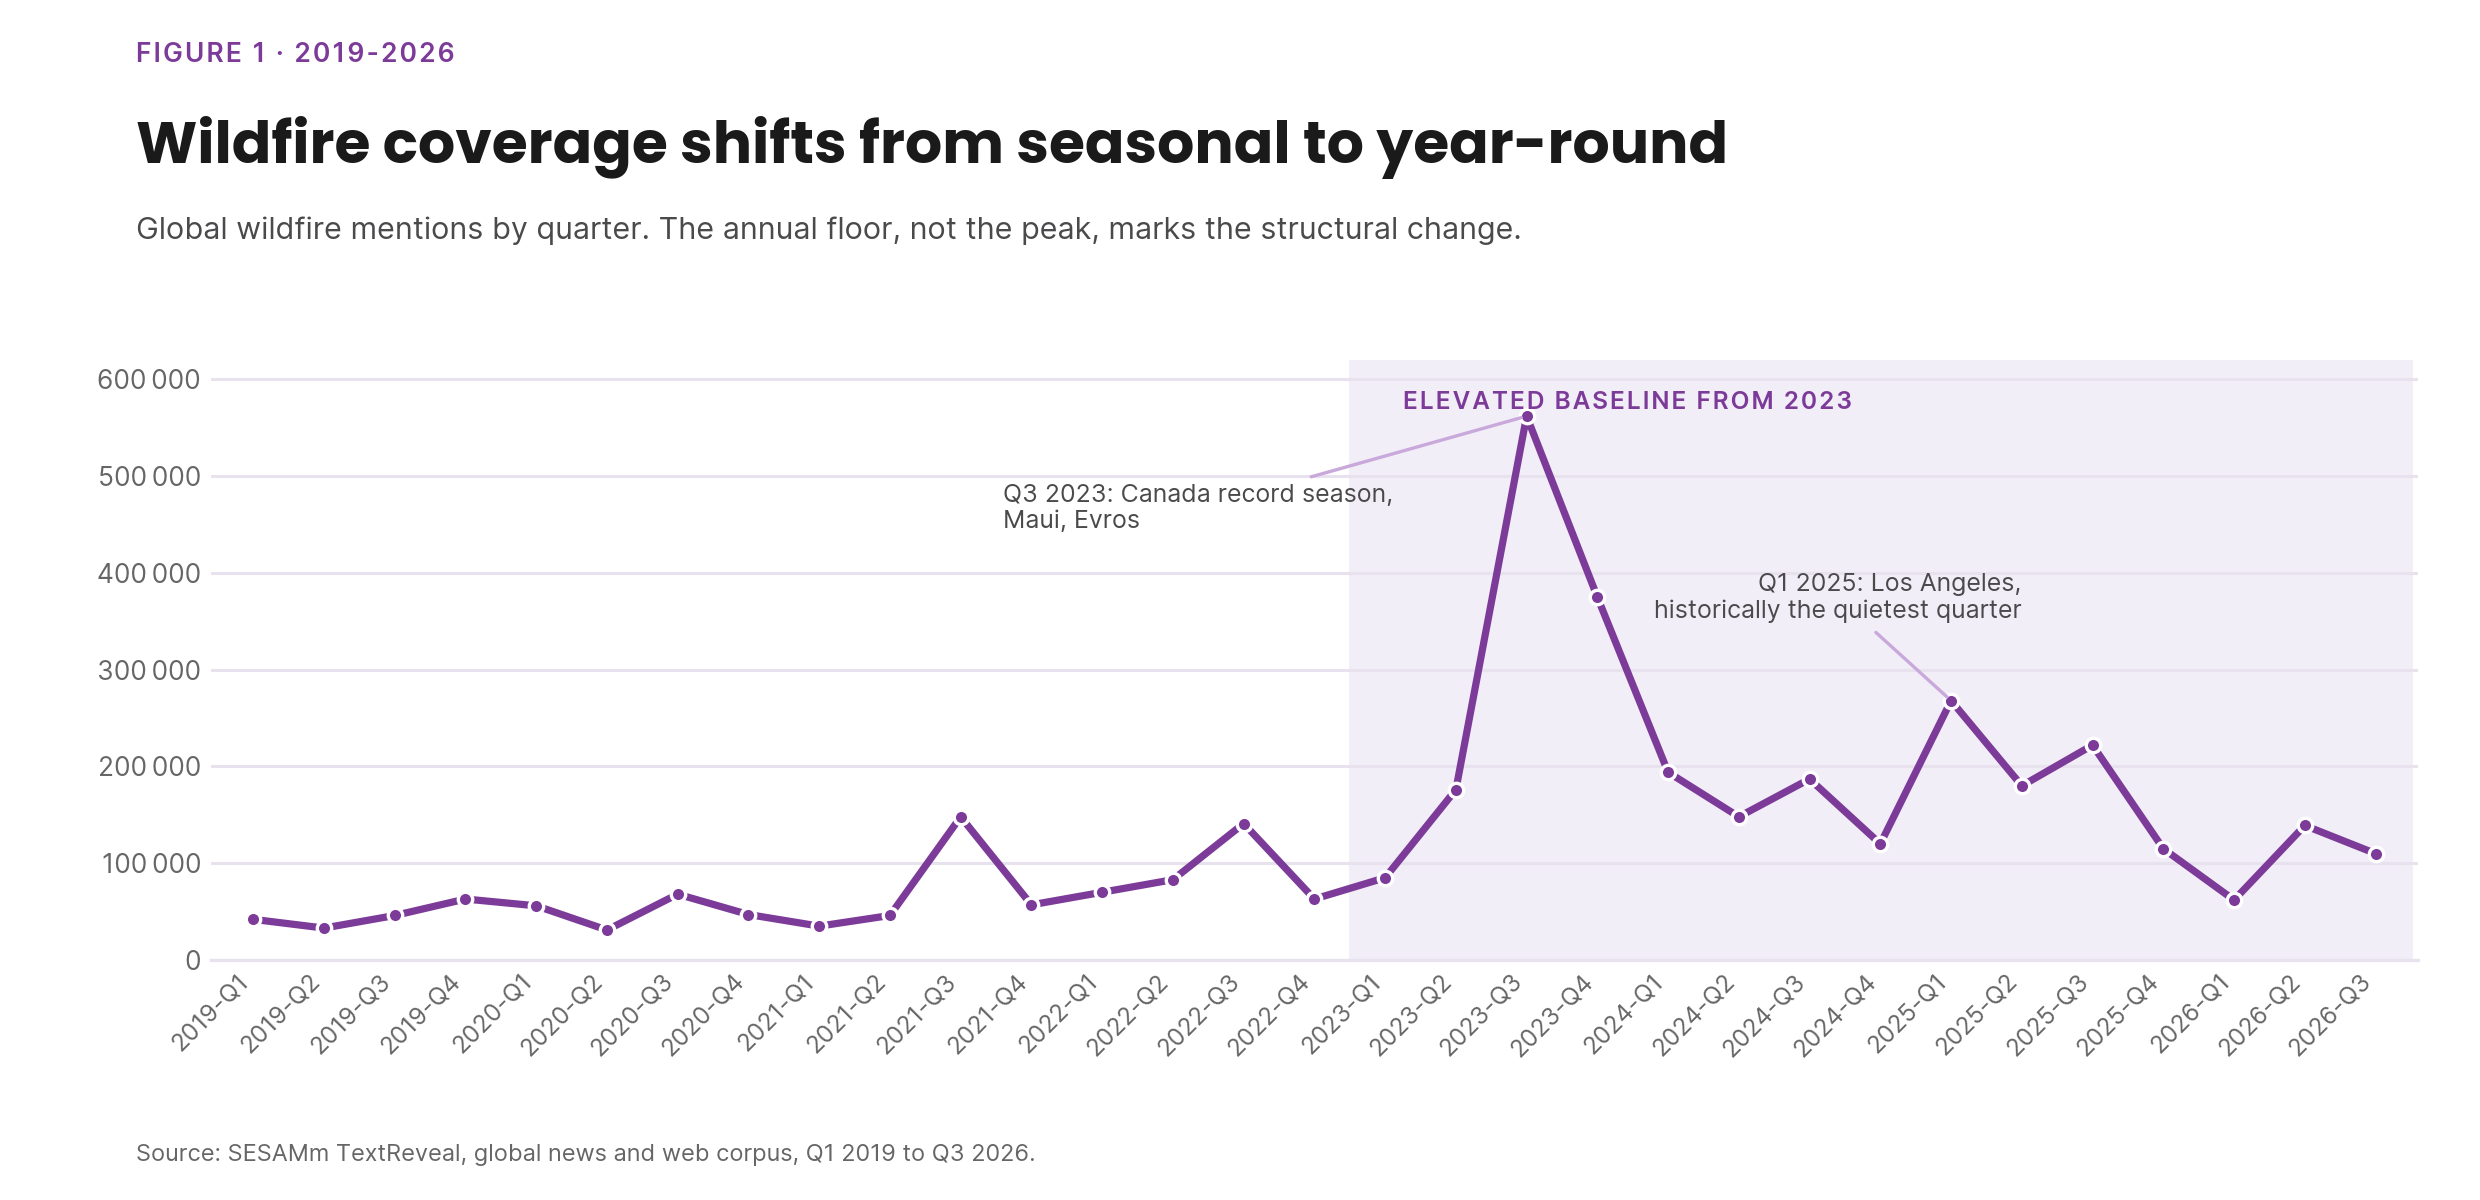
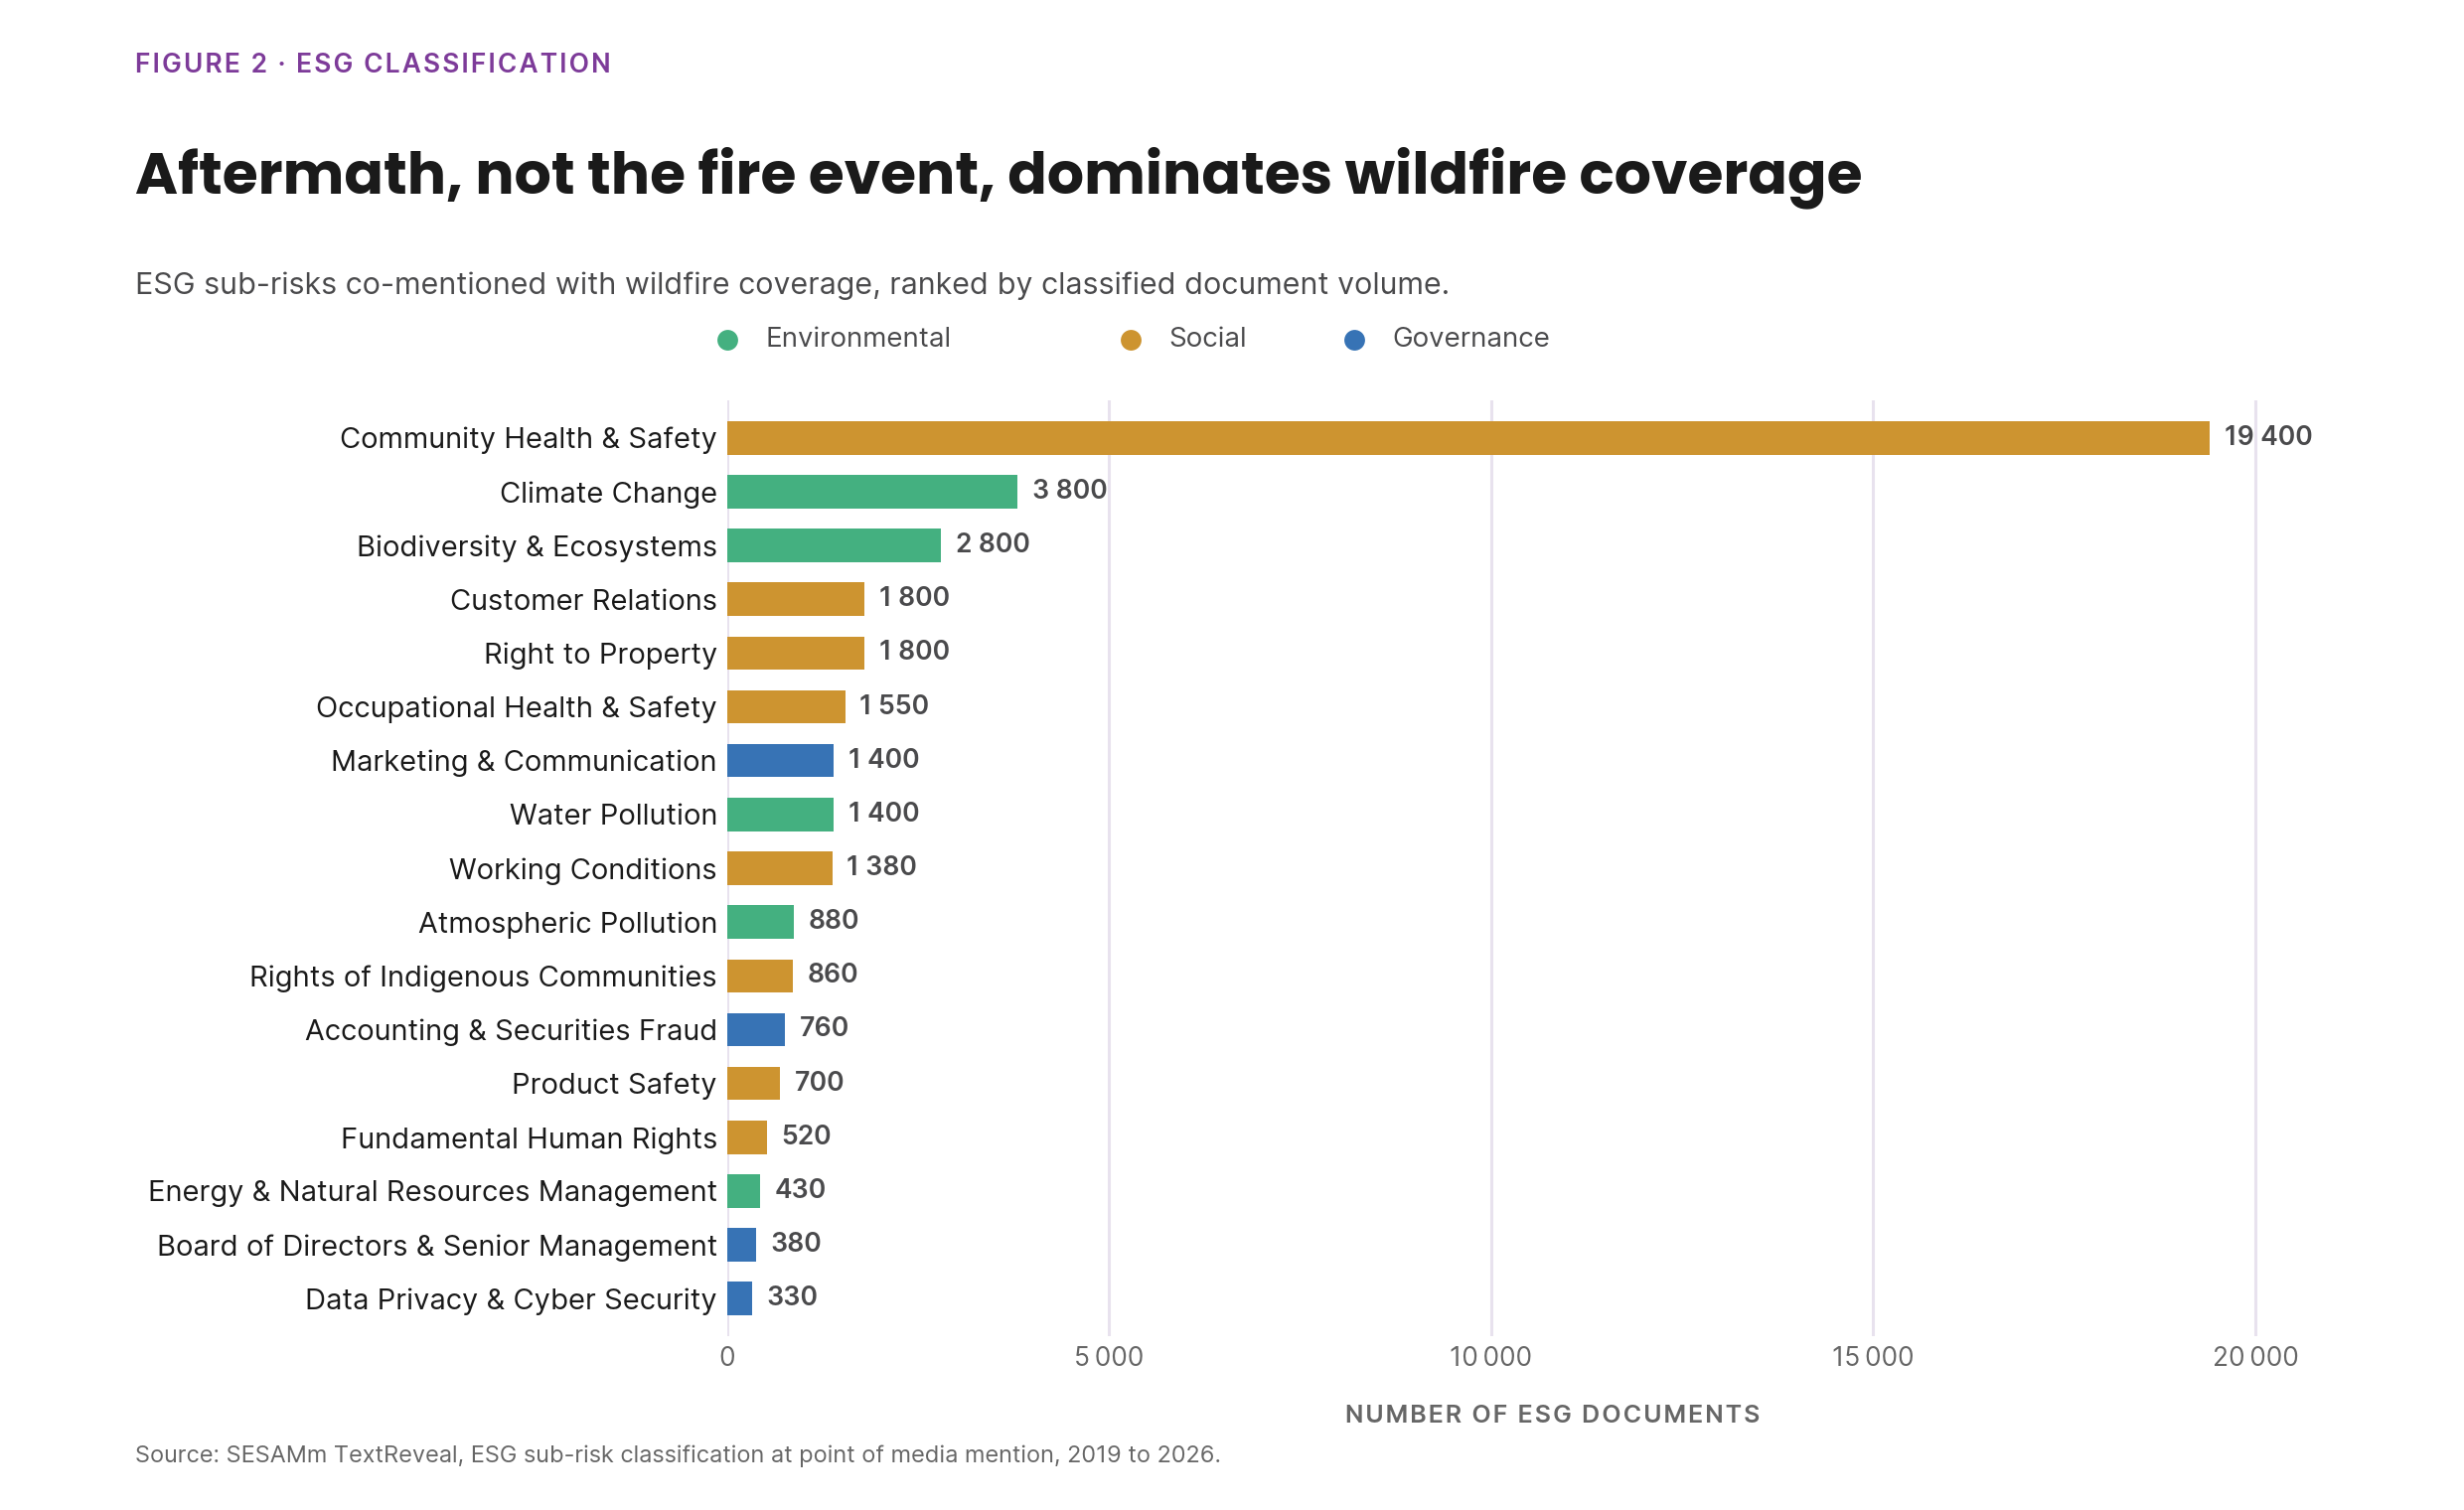
This analysis reviews global wildfire mentions between 2019 and 2026 across three lenses: quarterly mention volume, ESG sub-risk classification, and country-level geographic distribution, cross-referenced against documented public reporting. Three findings stand out: (1) wildfire coverage has shifted from a seasonal pattern to a sustained, year-round baseline since 2023; (2) coverage volume tracks proximity to population centers and identifiable liable parties more closely than it tracks the physical scale of the fire itself; and (3) the dominant subject matter in wildfire-related ESG coverage is the aftermath (casualties, contaminated water and air, insurance exposure, litigation) rather than the fire event in isolation.
1. Mention volume over time: a seasonal story becomes a year-round one
For most of the period, the data follows a predictable four-quarter cycle: Q1 is the annual low, Q2 shows a moderate rise, Q3 spikes with the Northern Hemisphere dry season, and Q4 falls back. That cycle breaks in two places, and both breaks mark a structural change rather than a one-off event.
Q4 2023 does not return to baseline after the Q3 peak: coverage stays elevated into the final quarter for the first time in the dataset.
Q1 2025, historically the lowest-volume quarter of the year, reaches roughly 270,000 mentions, more than several previous Q3 peaks.
The floor is the more telling number. In the quarters before 2023, non-peak volume rarely exceeded 80,000 mentions. From 2023 onward, even the quietest quarters do not fall below roughly 110,000–190,000. Wildfires have moved from a seasonal hazard to a year-round subject of coverage.
It's worth noting what does not explain this shift: acreage burned. 2020 through 2022, the years directly before this data climbs, include some of the largest fires by area in modern US and European history, yet register comparatively modest mention volume, partly because those years overlapped with the COVID-19 pandemic, which absorbed a large share of global news capacity.
The years that do dominate the chart, 2023 and 2025, are not necessarily the years with the most land burned; they are the years fire reached population centers and produced an identifiable party to blame. The Lahaina, Marshall, and Los Angeles fires are all comparatively small by area next to the 2020 US West Coast season or Canada's 2023 season, but generated substantially more coverage because of death toll, structures destroyed, and utility liability. Acreage, in short, is a weak predictor of coverage; proximity and blame are strong ones.
What was happening on the ground behind each peak
Each Q3 peak in the dataset lines up with a specific, documented cluster of events:
Q3 2022: fires threaten the Yosemite region and Sequoia groves in California; Spain and Portugal report wildfires during a European heat wave; a federal review attributes a New Mexico wildfire to a botched prescribed burn.
Q3–Q4 2024: a wildfire cuts power to Labrador; another burns near Suncor's Firebag oil-sands site in Alberta; Jasper, Alberta is significantly damaged; Greek investigators attribute the country's worst fire of the year to a faulty power cable.
Q1 2025 (the anomaly): a 14-fire outbreak tears through Los Angeles and San Diego County over January 7–31 on Santa Ana winds; the Palisades and Eaton fires alone destroy more than 18,000 structures and kill at least 31 people, with over 200,000 evacuated. Property-value loss is estimated at roughly $31 billion by CoStar, with total economic loss estimated between $250–275 billion by AccuWeather. Days later, the European Forest Fire Information System reports more than 100,000 hectares burned across the EU by the end of March, three months ahead of the typical season.
Across every year in the dataset, the same mechanism converts a fire into a sustained story: ignition (lightning, arson, or utility equipment failure) combines with drought and wind to produce the initial event, but litigation and identified liability sustain the coverage long after the fire is contained. PG&E, Southern California Edison, PacifiCorp, and Hawaiian Electric recur as named defendants across separate fires and separate years.
Wildfire-related controversies were classified into ESG sub-risk categories at the point of media mention. The ranking below runs from highest to lowest mention volume, with a documented, sourced example behind each category.
Climate Change: wildfires are framed as both symptom and accelerant. Canada's 2023 season burned at roughly seven times the historical average; researchers found climate change had tripled the underlying fire risk in the country's boreal forest, and the season released an estimated 1.5 billion metric tons of CO2, comparable to a decade of Canada's typical wildfire emissions.
Customer Relations: reflects the California property-insurance crisis: State Farm nonrenewed roughly 72,000 California policies in the two years before the January 2025 fires, then faced a state investigation into claims handling, including denial of hygienic smoke-damage testing, after the fires it did cover. A $1 billion FAIR Plan assessment was subsequently levied on insurers operating in California.
Right to Property: tied to the scale of destroyed real estate, an estimated $31 billion in property value destroyed in the January 2025 Los Angeles fires, and to litigation over responsibility for that loss, including Los Angeles County's lawsuit against Southern California Edison and Edison's countersuit against the county.
Marketing & Communication: covers corporate communications during active disasters, including relief pledges, the Recording Academy and MusiCares pledged $1 million to Los Angeles wildfire relief in January 2025, and utility crisis messaging, which came under renewed scrutiny after Edison International executive pay continued to rise during the period the company faced Eaton Fire liability claims.
Working Conditions: wildland and municipal firefighting workforce strain during extended, overlapping fire seasons across multiple continents.
Atmospheric Pollution: principally the June 2023 Canadian smoke event: New York City's air quality index peaked at 465, with a 24-hour PM2.5 average nearly three times the US regulatory standard, and follow-on research linked the event to a 44–82% increase in asthma-related emergency-department visits in the city.
Accounting & Securities Fraud: the Edison International shareholder class action filed after the Eaton Fire, alleging the company misrepresented the readiness of its power-shutoff program; Edison's share price fell approximately 34% following the fire, and the suit names CEO Pedro Pizarro and CFO Maria Rigatti as defendants.
The remaining categories (Product Safety, Fundamental Human Rights, Energy & Natural Resources Management, Board of Directors & Senior Management, and Data Privacy & Cyber Security) account for smaller shares of classified documents and were not tied to a comparably documented recurring event pattern in this dataset.
3. Geographic distribution of coverage
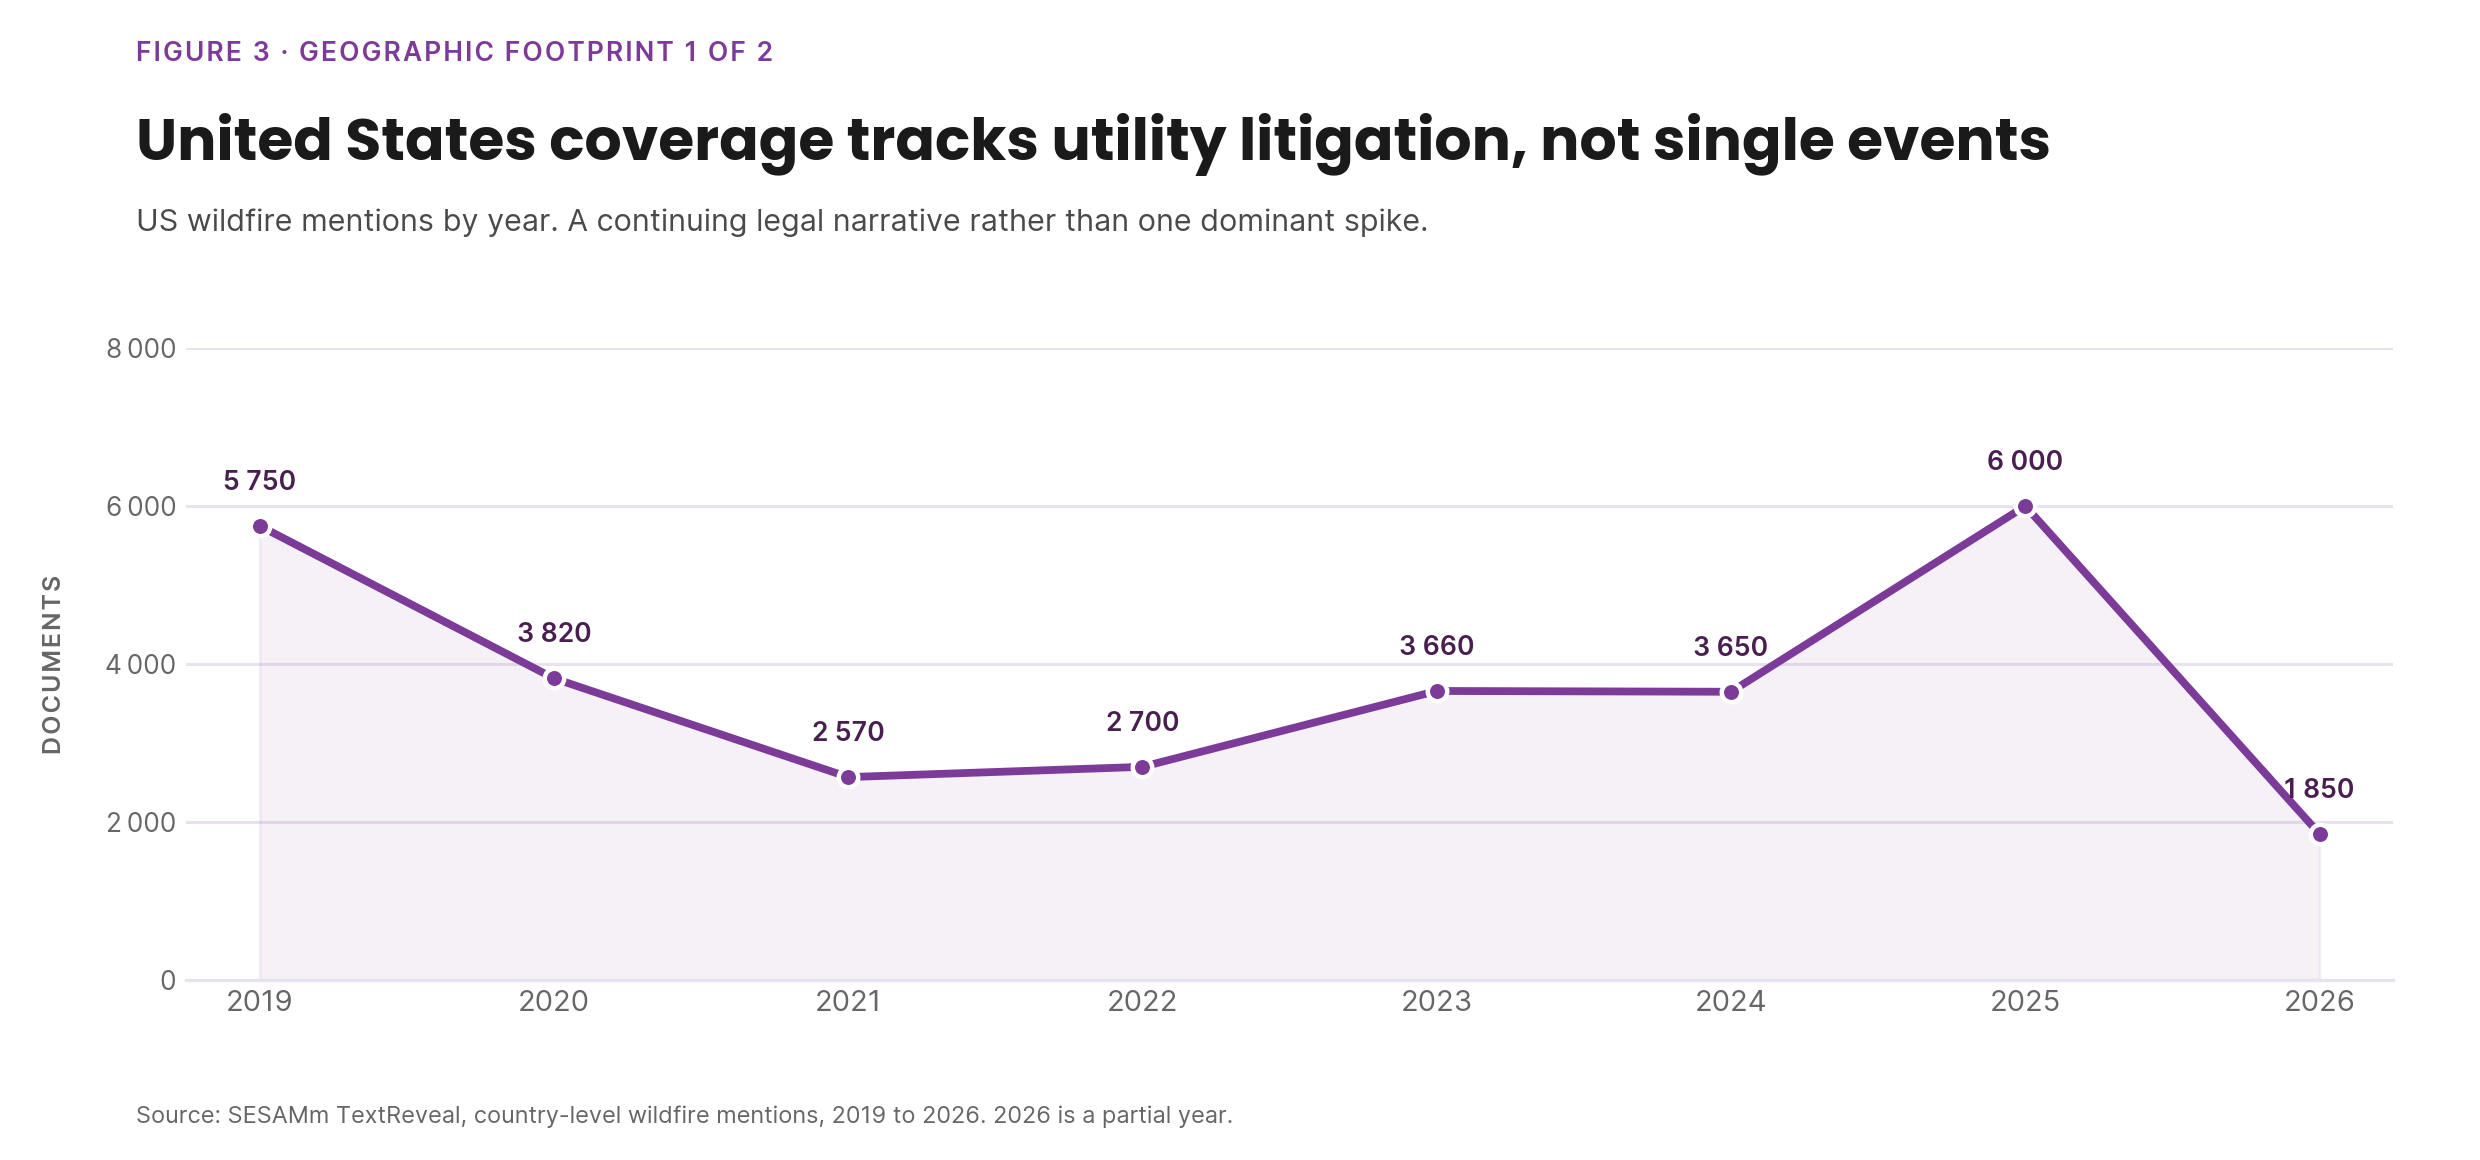
The United States accounts for the largest share of country-level mentions throughout the period, without a single dominant spike: volume rises through 2023–2025, peaks around 2025, then falls sharply into 2026. That shape fits a continuing sequence of named utility liability cases (PG&E, Southern California Edison, PacifiCorp) more than it fits a single event.
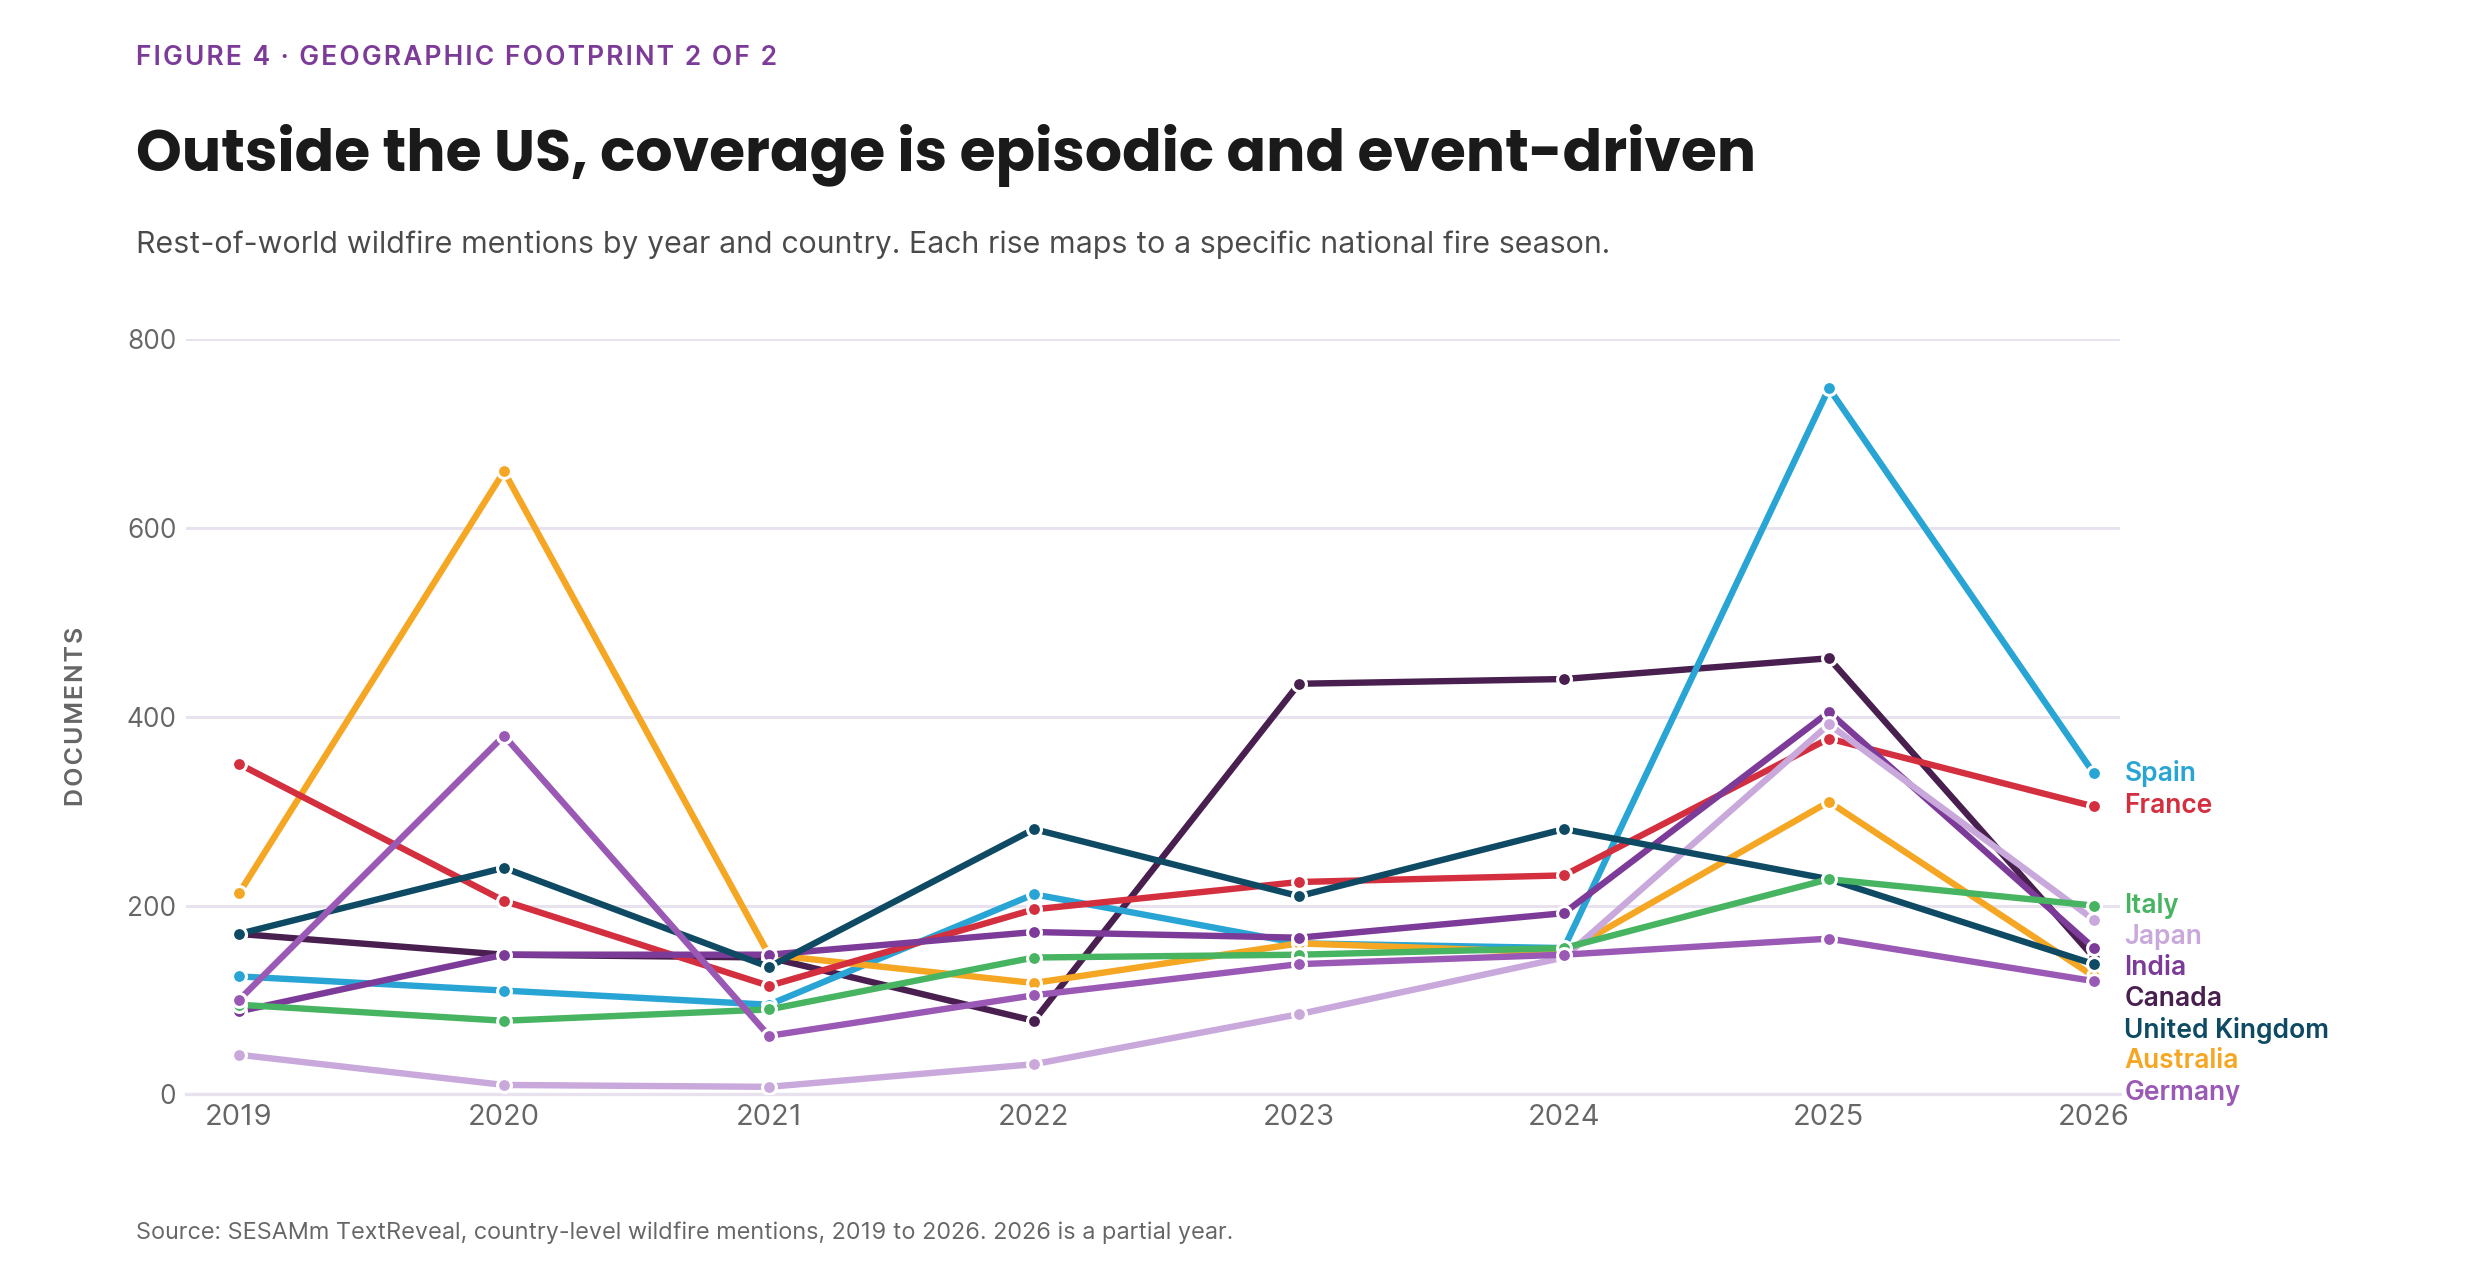
Outside the US, coverage is more episodic, clustering around identifiable national events rather than building a sustained baseline:
Australia peaks sharply around 2019–2020, matching Black Summer (24 million hectares burned, 33 deaths, an estimated three billion animals affected), then recedes.
Canada rises from 2022 and peaks around 2025, matching the record 2023 season (roughly 15–18 million hectares, eight firefighter deaths, up to 232,000 evacuated) and the continuation of large fires in 2024, including Jasper.
Greece shows a sustained late-period rise, matching the 2023 Rhodes evacuation and the Evros fire, followed by continued fire activity in 2024, including the faulty-power-cable fire investigators called the country's worst of the year.
Spain shows its highest point at the end of the series, consistent with the unusually early 2025 season (100,000+ hectares burned across the EU by end of March) and recurring summer wildfire and heat-wave coverage in 2022.
France, Germany, India, Italy, Japan, and the United Kingdom register comparatively low, stable volumes throughout, with modest increases around 2024–2025 in line with the broader post-2023 elevated baseline rather than country-specific events.
Read together, US coverage behaves like an ongoing institutional and legal narrative anchored by utility litigation, while rest-of-world coverage behaves like a series of discrete, event-driven spikes tied to specific fire seasons.
Conclusion
Across mention volume, ESG classification, and geography, the evidence points to a consistent mechanism. Coverage volume is driven primarily by three factors: proximity of the fire to population centers, the presence of an identifiable liable party, typically a utility, and how much a competing global news cycle is absorbing attention capacity at the same time. The physical scale of a fire is, on its own, a comparatively weak predictor of how much coverage it receives. On that basis, the next spike in wildfire coverage is more likely to come from an urban-interface fire with a clear liability story than from the largest fire by area.
Stay ahead with the latest in ESG and AI intelligence
Join our mailing list to receive new reports, event invites, and updates from SESAMm directly to your inbox.




.jpg)


.png)